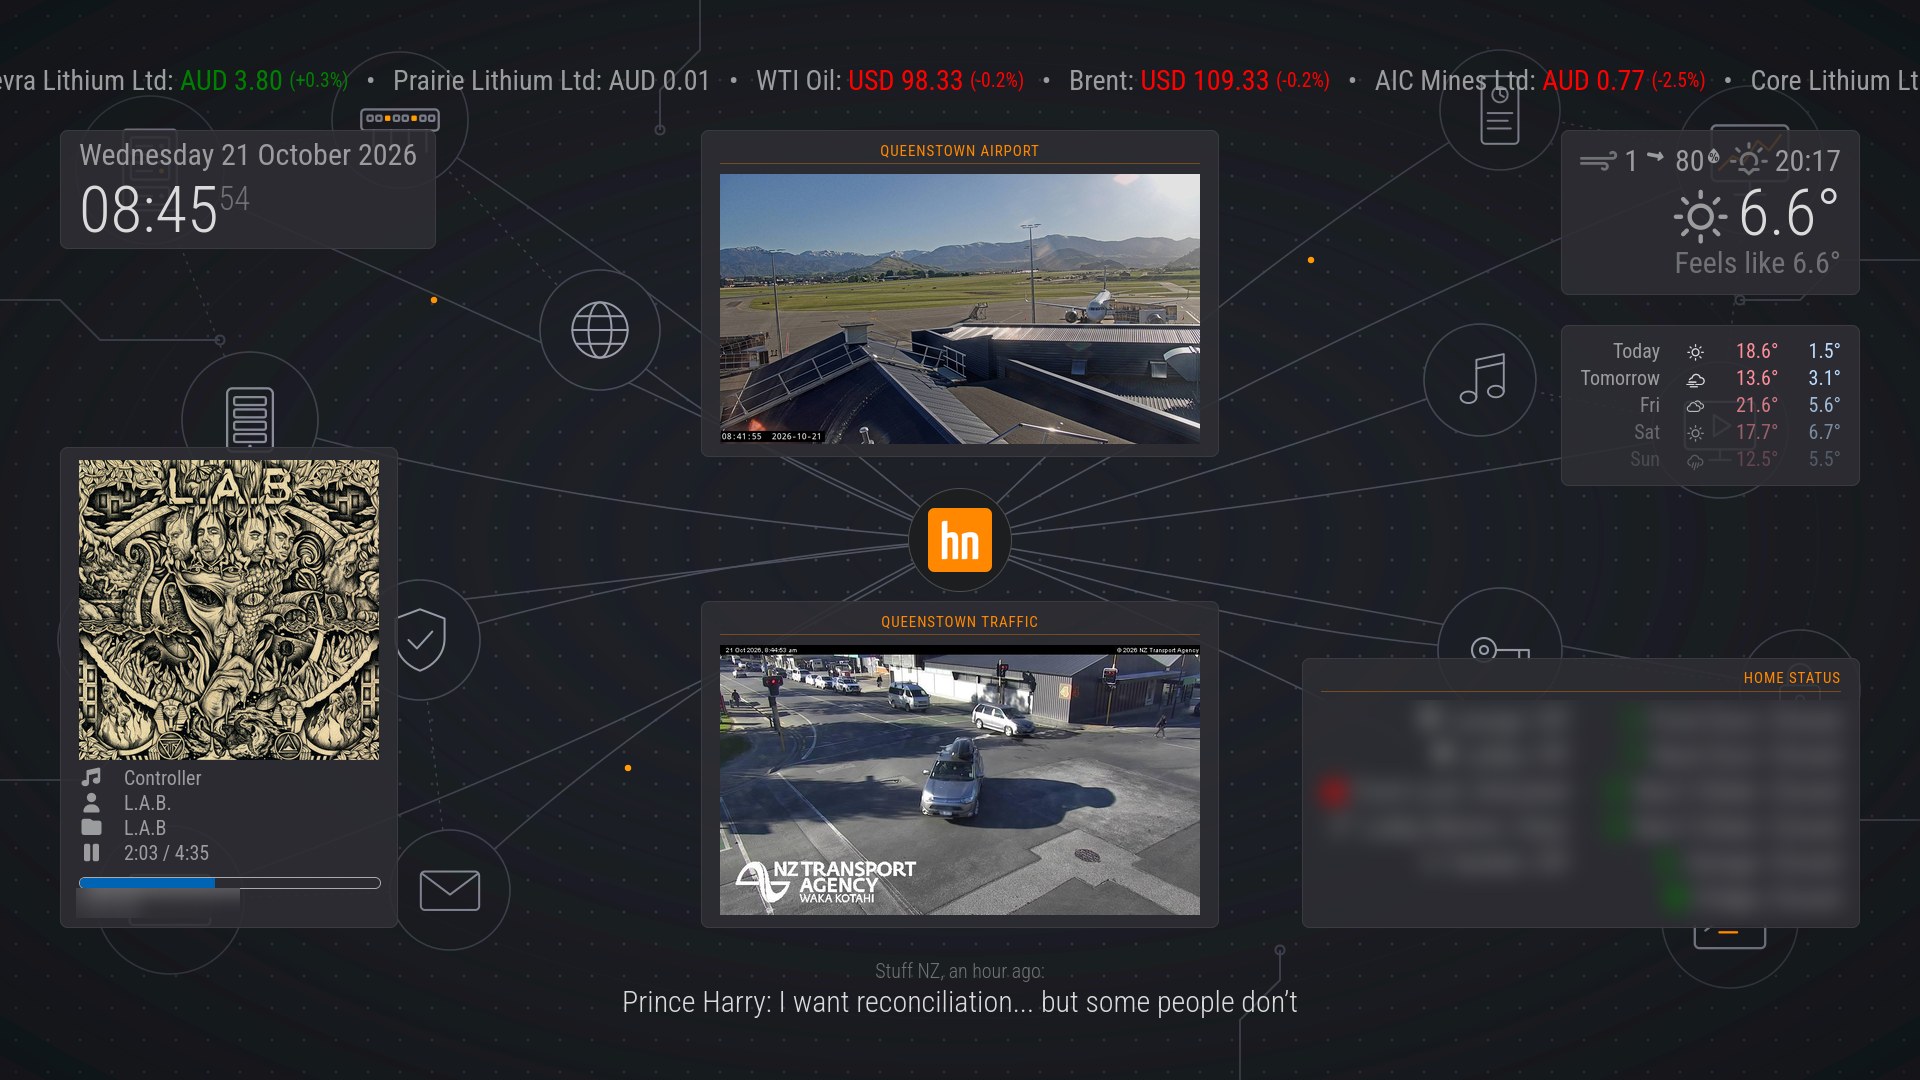
The wall dashboard's home page: stock ticker, clock, Spotify, airport and traffic webcams, weather and the Home Status panel on dark suite cards, over the Hillnet line-art with the hn logo at its centre

MagicMirror² Wall Dashboard, Now With Home Lab Pages

A MagicMirror² dashboard with weather, Home Assistant, Spotify, news, stocks and webcams, now rotating through two read-only Grafana pages for the home lab. Covers the hardware history, the kiosk setup and how Grafana is embedded safely.
April 15, 2026 · Updated today · 16 min · Roland Hill
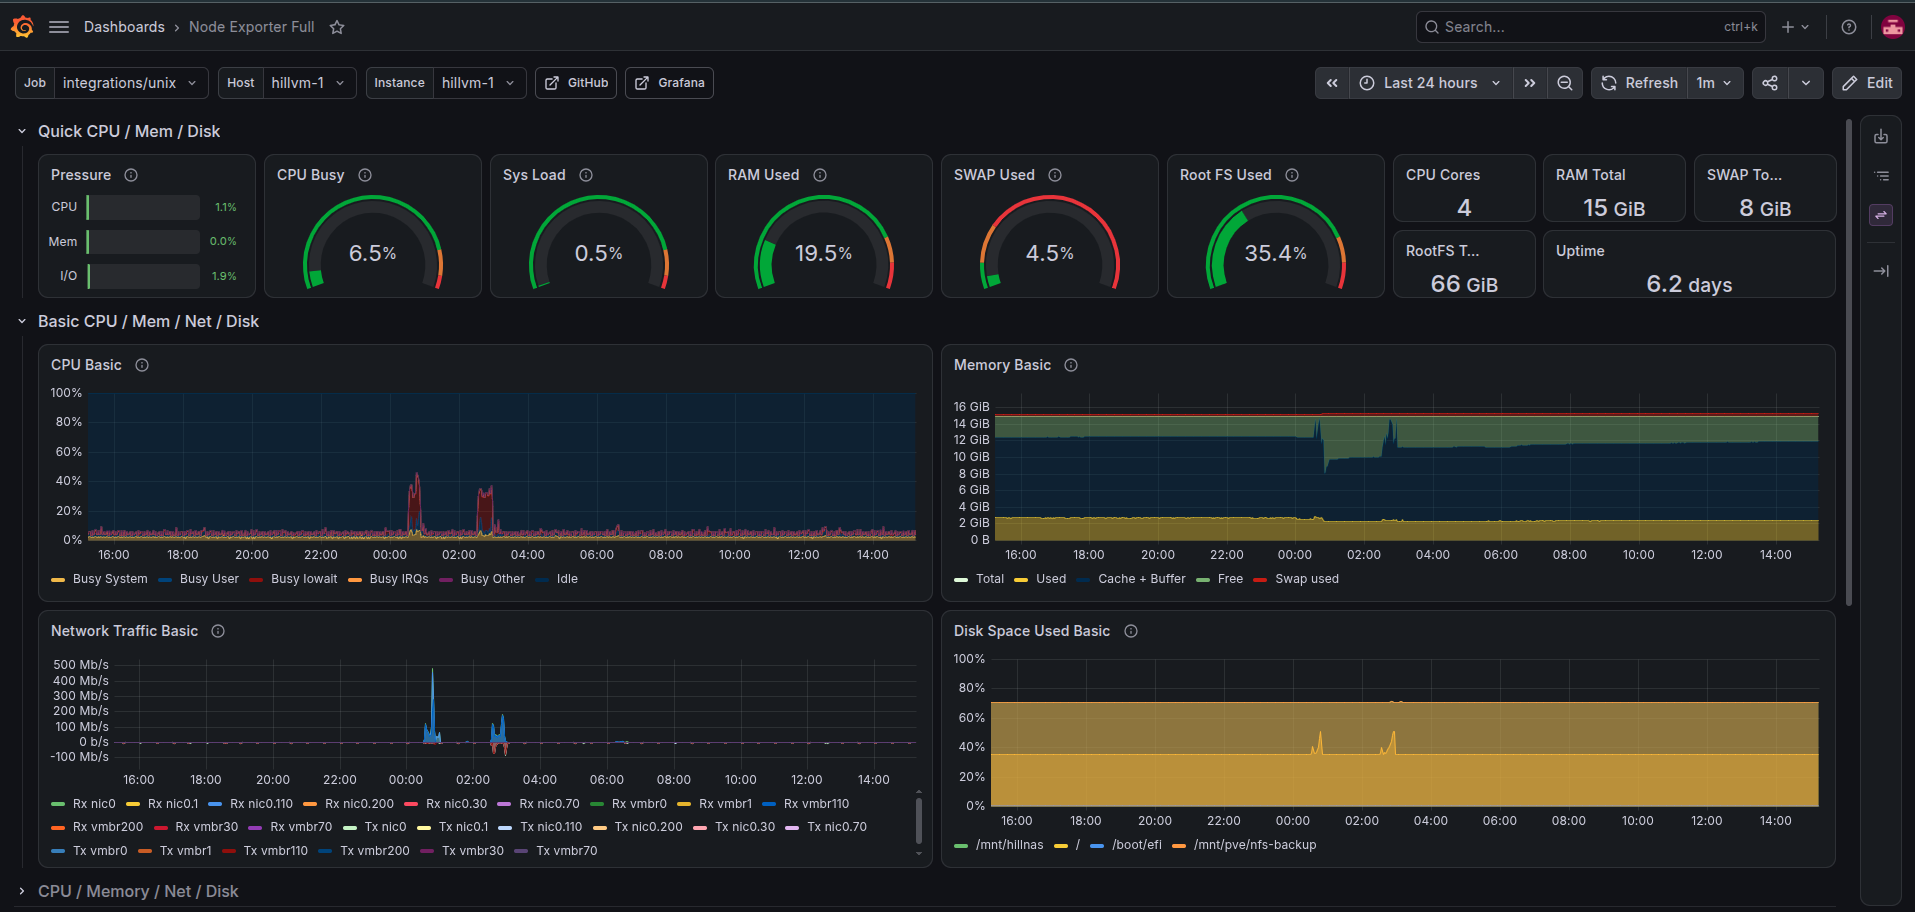
A Grafana Node Exporter Full dashboard showing CPU, memory, network and disk usage

Homelab Monitoring with Grafana, Loki, Prometheus and Alloy

How I centralised logs and metrics for my homelab with Grafana, Loki, Prometheus and Grafana Alloy, and what I learned about push-based collection, alerting and code-generated dashboards.

October 1, 2026 · Updated October 14, 2026 · 9 min · Roland Hill

3-Node Proxmox Cluster on EliteDesk Minis

A 3-node Proxmox cluster on EliteDesk Mini PCs: shared iSCSI storage on a dedicated storage VLAN, HA for the services that matter, and backups that no longer depend on a single box.

February 22, 2026 · Updated October 14, 2026 · 7 min · Roland Hill