Overview
For a long time, troubleshooting my homelab meant SSHing into each box and running journalctl. That stops working when you have a Proxmox cluster, a dozen containers, a NAS and network gear that all log to different places. So I built a central monitoring stack.
The stack runs as one Docker Compose project inside an LXC container on my Proxmox cluster:
- Loki stores logs
- Prometheus stores metrics
- Grafana handles dashboards and alerting
- Grafana Alloy collects logs and metrics, both on the monitoring host and as an agent elsewhere
- pve-exporter reads cluster state from the Proxmox API
- Diun tells me when container images have new releases
Today it takes logs and metrics from the Proxmox nodes, the mail and web servers, other service containers, the NAS, the backup server, the DNS filter and the UniFi network. Host names and addresses are left out of this post.
Architecture
syslog receiver + local metrics"] LOKI["Loki"] PROM["Prometheus"] PVEX["pve-exporter"] GRAF["Grafana"] DIUN["Diun"] end PVE -- logs --> LOKI PVE -- remote_write --> PROM SVC -- logs --> LOKI SVC -- remote_write --> PROM NAS -- syslog --> ALLOY NET -- syslog --> ALLOY RS -- syslog --> ALLOY ALLOY --> LOKI ALLOY --> PROM PVEX -- Proxmox API --> PVE PROM -- scrape --> PVEX LOKI --> GRAF PROM --> GRAF GRAF -- alerts --> MAIL["Mail relay"] GRAF -- alerts --> PUSH["Push notifications"] DIUN -- image updates --> PUSH
Push, not pull
Prometheus normally scrapes its targets. I turned that around. Every agent host runs Alloy natively. Alloy reads the systemd journal and selected log files, runs the built-in Unix exporter, and pushes metrics to Prometheus with remote_write. Prometheus has the remote-write receiver enabled. It only scrapes itself and pve-exporter.
Why do it this way:
- Hosts don’t need a listening exporter port, so there is less to firewall on each one
- Adding a host is “install the agent”, not “install the agent and also edit the scrape config”
- Logs and metrics come from one agent with one config file
A minimal agent config looks something like this. The host name and the monitoring server’s address are examples:
| |
On the Prometheus side, the receiver is a single flag. For example, in Compose:
| |
The cost is that “no data” can mean the host is down or the agent is broken. A “host not reporting” alert covers both cases.
Agent installer
I wrote one idempotent install script and run it over SSH from my workstation. It adds the Grafana apt repo after checking the signing key fingerprint. It pins that repo so it can only supply the alloy package. It writes the config and then waits until logs and samples are really arriving before it reports success. A per-host variable sets which systemd units are watched. On Proxmox nodes the script also skips per-container ZFS datasets and the virtual network interfaces, which would otherwise flood the metrics.
For a VM with no SSH key from my workstation, I ran the same script through the QEMU guest agent from its Proxmox node.
Syslog for everything else
Appliances such as the NAS and UniFi gear can’t run an agent, but they can send syslog. The containerised Alloy listens for RFC 5424 syslog over TCP and UDP, and has a separate raw-line listener for UniFi. UniFi sends events in CEF format. An Alloy processing stage pulls the real device name, product and severity out of the CEF body and maps them onto the same host, app and level labels the rest of the fleet uses. This was needed because the syslog hostname UniFi Network sends is a container ID.
A few small containers (backup server, DNS filter) use rsyslog to forward only warning and above, with a disk-assisted queue. They keep no local log files, and the journal stays the local copy.
Proxmox
pve-exporter talks to the Proxmox API with a read-only token that has the built-in auditor role. One gotcha: cluster-wide series come back once per node you query, so every query needs a max by (id) or the panels show everything three times. For example, guests that are set to start on boot but aren’t running:
| |
Dashboards and Alerts as Code
The dashboards I built myself (hosts overview, mail server, Proxmox cluster, network syslog, and an all-hosts “Problems” view) are generated by Python scripts. I don’t edit them in the UI. The same goes for the 22 alert rules, which are provisioned from generated YAML. Provisioned rules are read-only in Grafana, and that turned out to be useful: the repo really is the source of truth.
A third script runs every panel query against the live Prometheus and Loki before I deploy. This has caught many typos in label names that would otherwise show up as an empty panel weeks later.
The alert rules fall into four groups:
- Hosts: not reporting, watched service down, disk and memory thresholds
- Mail: queue size, deferred mail, certificate expiry, blocklisting, DKIM/DANE/PTR consistency
- Proxmox: quorum lost, autostart guest not running, storage filling up
- Syslog (LogQL over 15-minute windows): error-level messages, disk/SMART problems, failed backup tasks, repeated failed logins, UPS events
A generated rule ends up as ordinary Grafana provisioning YAML. A trimmed example:
| |
The syslog rules are LogQL instead. Counting failed logins per host looks like this:
| |
Alerts go out two ways. Email goes through the existing mail relay. Push notifications go through ntfy, with a separate topic per source (alerts and image updates). With public ntfy, the topic name is effectively the password, so the names are random and stored as secrets, not committed to git.
Diun runs in notify-only mode. It watches the running containers, checks for newer semver tags on pinned images, and sends a push notification. It never pulls or restarts anything. I want to read the changelog before I upgrade, not after.
Hardening
- Grafana listens only on localhost. A TLS reverse proxy on the same host publishes it to the LAN.
- The Loki and Prometheus ingestion ports are limited to an allow-list of shipping hosts in Docker’s
DOCKER-USERiptables chain. This is a separate systemd unit, not part of Compose. - All credentials (Grafana admin password, Proxmox token, ntfy topics) are Docker secrets or root-only env files outside the repo.
The allow-list idea in its simplest form, with documentation addresses standing in for the shipping hosts. Rules are inserted at the top of DOCKER-USER, so the DROP goes in first and the ACCEPTs land above it:
| |
What Worked / What Didn’t
Worked
- One agent for logs and metrics. Alloy replaced what would have been Promtail plus node_exporter on every box.
- Generated dashboards. Changing a label convention means changing it in one Python function, not in forty panels.
- Consistent labels. Every source, whether agent, rsyslog or CEF, ends up with
host,appandlevel. The Problems dashboard can then show everything at once. - Notify-only image updates. No surprise breakage from a silent auto-upgrade.
Didn’t (at first)
- The firewall blocked my own containers.
DOCKER-USERalso filters traffic between containers on the Compose bridge network. Alloy was reading logs fine, but its sent-entries counter stayed at zero. I now resolve the bridge subnet at runtime and allow it, instead of hardcoding it. - Datasource errors during backups. A large VM backup job starved the shared storage. Prometheus queries timed out and every rule fired a “DatasourceError” email. Setting rules to keep their last state on error stopped the noise. The one exception is “host not reporting”, which must fire when data disappears.
- The container was too small. Everything got slow and
journalctlhung. Tightening the memory limits made it worse. The real problem was page-cache thrashing, which showed clearly in/proc/pressure/io. Giving the LXC more RAM fixed it.
Tradeoffs
Advantages
- One place to search logs across the whole lab
- New hosts and devices appear on dashboards and in alerts automatically, by label
- Everything except secrets is in git and reproducible
Limitations
- Alerting shares infrastructure with what it monitors, so an external uptime service watches the public sites as an independent second opinion.
- Short log retention (a week) to keep the disk footprint small. Metrics are kept for 30 days.
- Raw syslog parsing in Alloy needs the experimental stability flag, so every upgrade needs a config validation step first.
- The deployed copy of the stack is synced from the repo by hand.
Lessons Learned
Loki retention does nothing without the compactor. Setting
retention_periodalone deletes nothing:1 2 3 4 5limits_config: retention_period: 720h # whatever suits your disk compactor: retention_enabled: true delete_request_store: filesystemAlloy comments use
//, not#. A YAML habit cost me a crash-looping container.docker compose up -dwon’t restart Prometheus for inline config changes. Use--force-recreate.Journal severities are long names (
error,critical), not syslog short forms. Filters that matcherr|critquietly miss them.Expect a burst of “entry too far behind” errors when Alloy restarts, because it re-reads the journal. Loki already has those lines, and the errors stop by themselves.
Validate queries against live data before deploying dashboards. Empty panels fail silently.
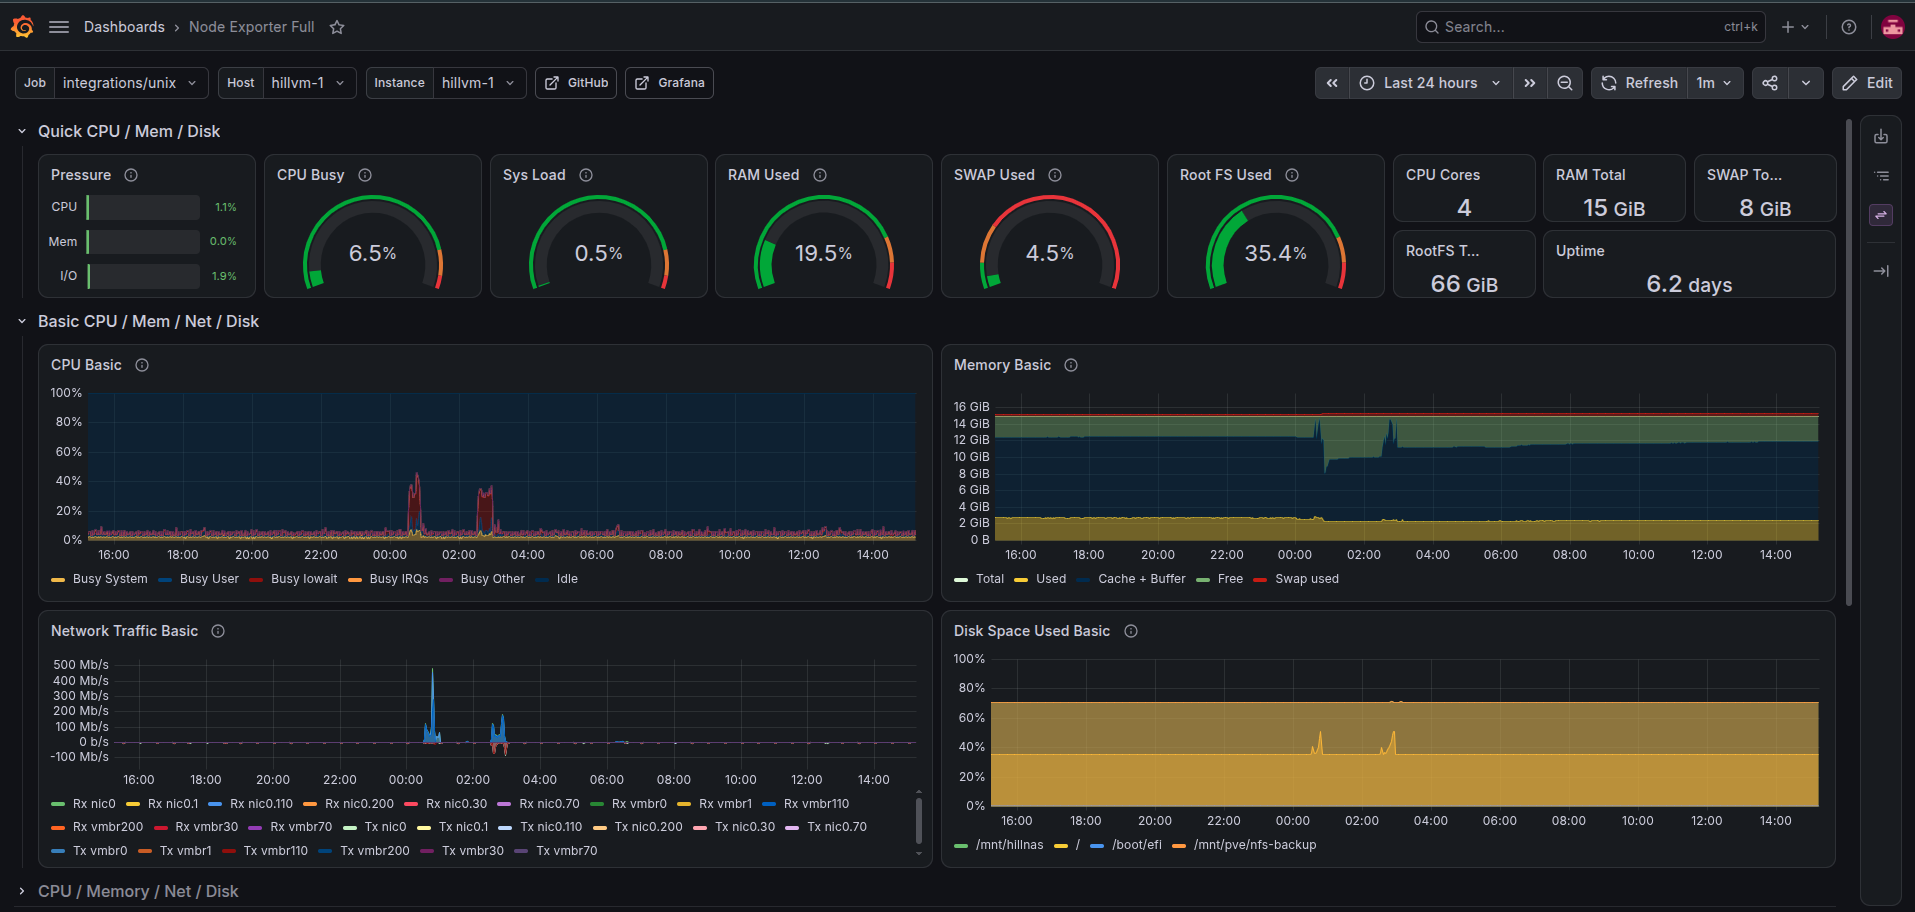
Fix slowness with pressure metrics, not guesses. PSI showed the real bottleneck right away.
The stack now answers “what happened at 3am?” in seconds, not half an hour of SSH sessions. That alone justified building it.
Comments