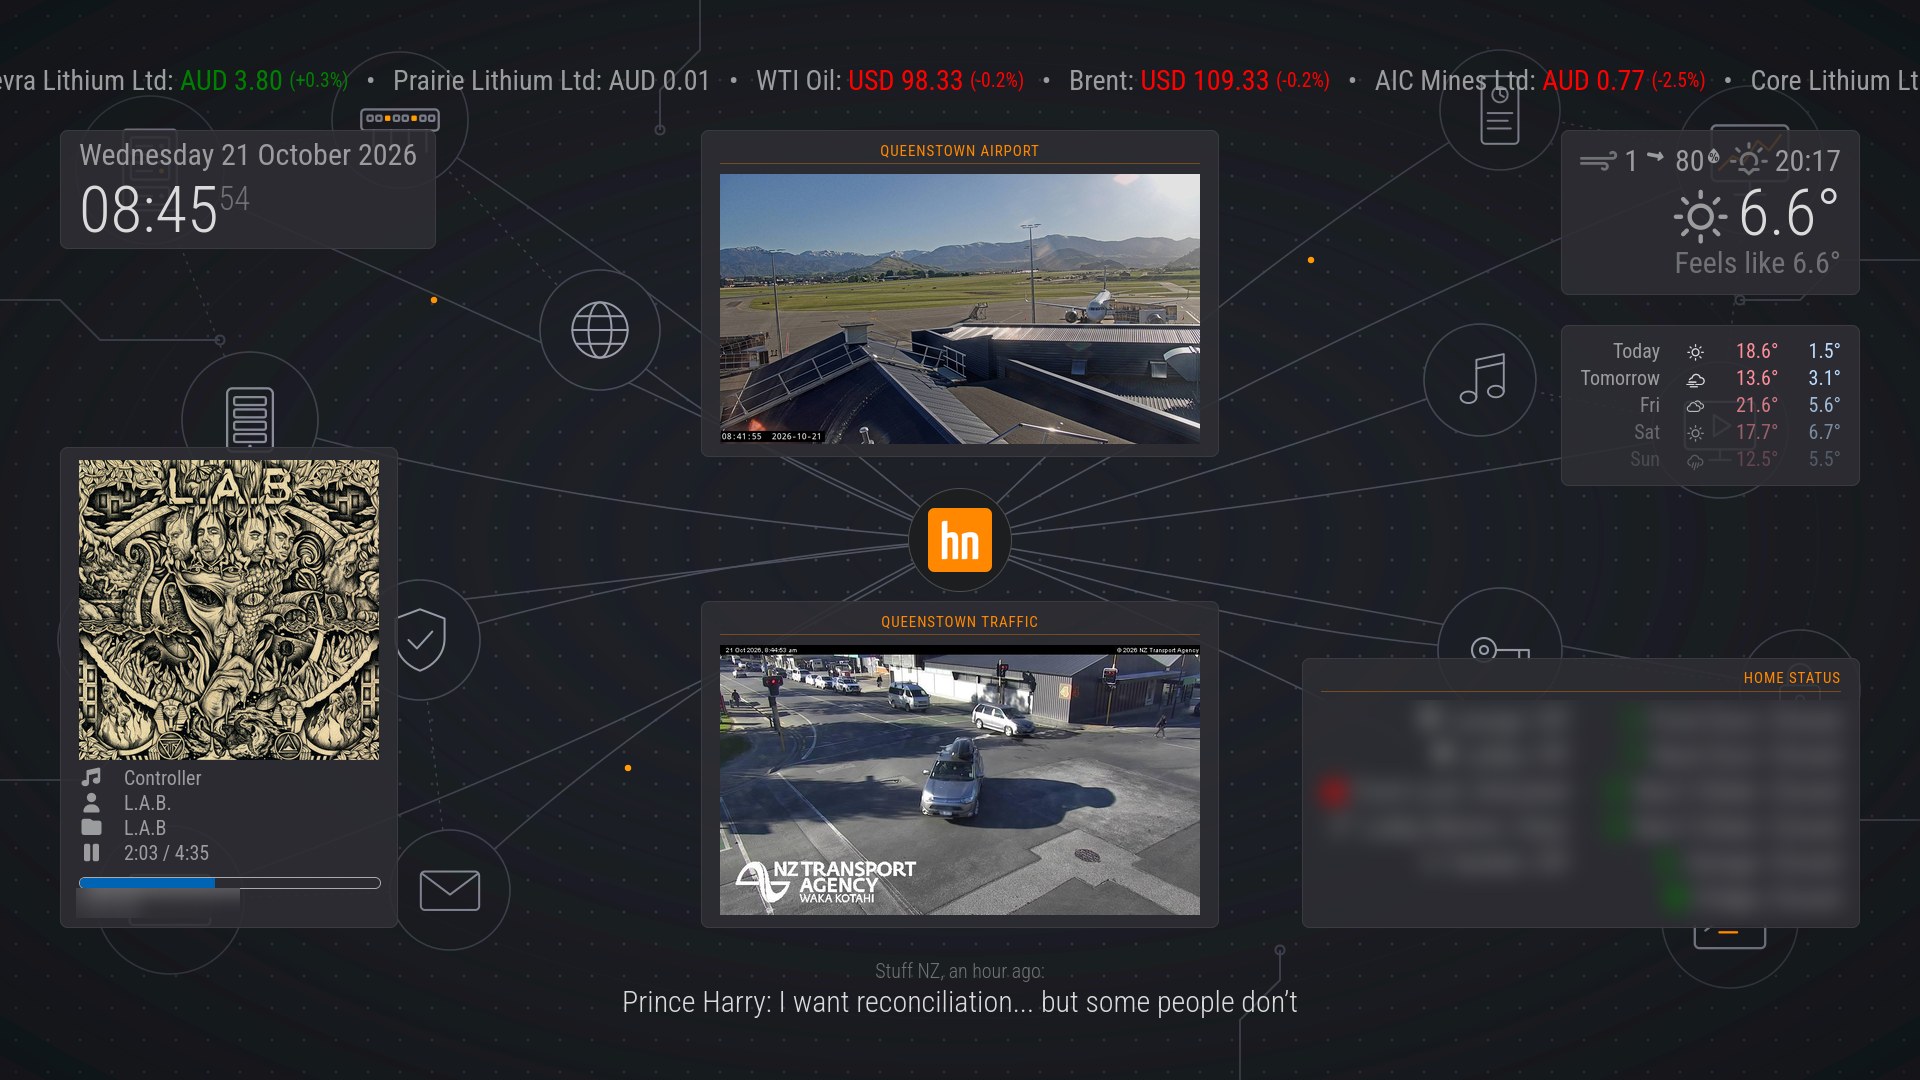
The wall dashboard's home page: stock ticker, clock, Spotify, airport and traffic webcams, weather and the Home Status panel on dark suite cards, over the Hillnet line-art with the hn logo at its centre

MagicMirror² Wall Dashboard, Now With Home Lab Pages

A MagicMirror² dashboard with weather, Home Assistant, Spotify, news, stocks and webcams, now rotating through two read-only Grafana pages for the home lab. Covers the hardware history, the kiosk setup and how Grafana is embedded safely.
April 15, 2026 · Updated today · 16 min · Roland Hill
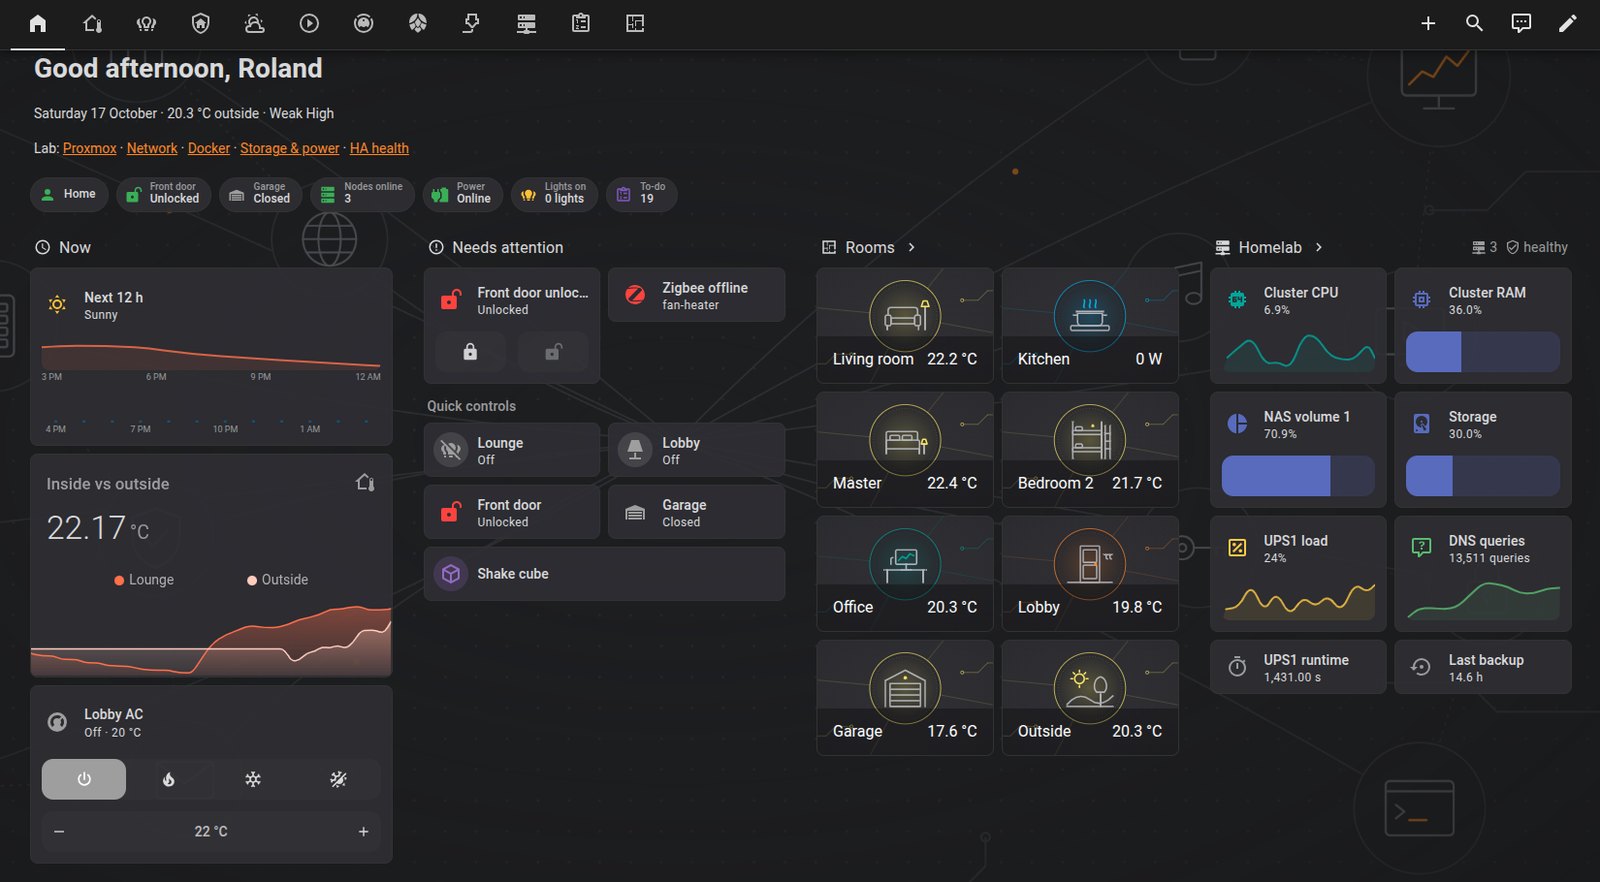
Home Assistant Home · PC dashboard with Now, Needs attention, Rooms and Homelab columns: weather and indoor-outdoor temperature graphs, quick controls, line-art room tiles and home lab status

Home Assistant OS in My Home Lab: How It's Configured

A revised tour of my Home Assistant OS install: the device fleets, small but useful template sensors, e-mail and phone alerts, and a repo-managed PC and mobile dashboard suite with strict design rules.

March 3, 2026 · Updated October 17, 2026 · 12 min · Roland Hill
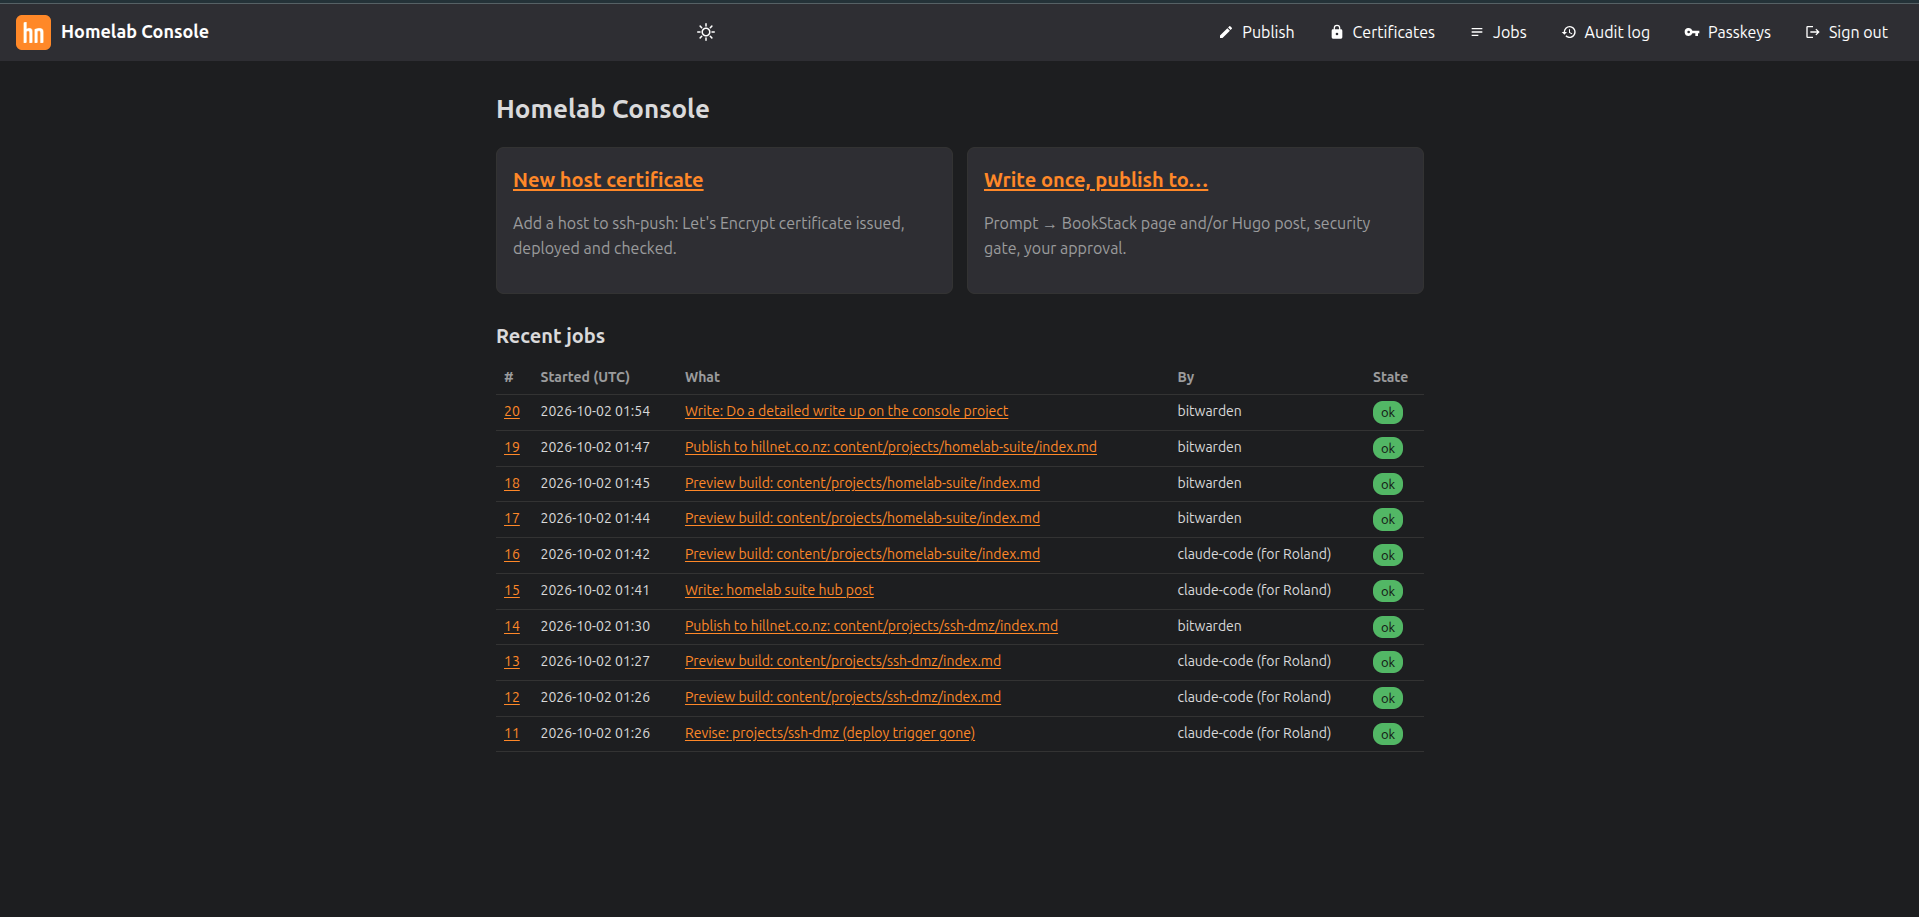
The Homelab Console dashboard in dark mode, showing Publish and Certificates actions and a recent jobs table

A LAN-Only Web Console for My Home Lab

The scripts I used to run by hand from my desktop now live behind a small LAN-only web console. It uses passkey sign-in and a fixed list of audited actions. Claude drafts pages, and a security gate checks them before I approve anything.

October 2, 2026 · Updated October 14, 2026 · 8 min · Roland Hill
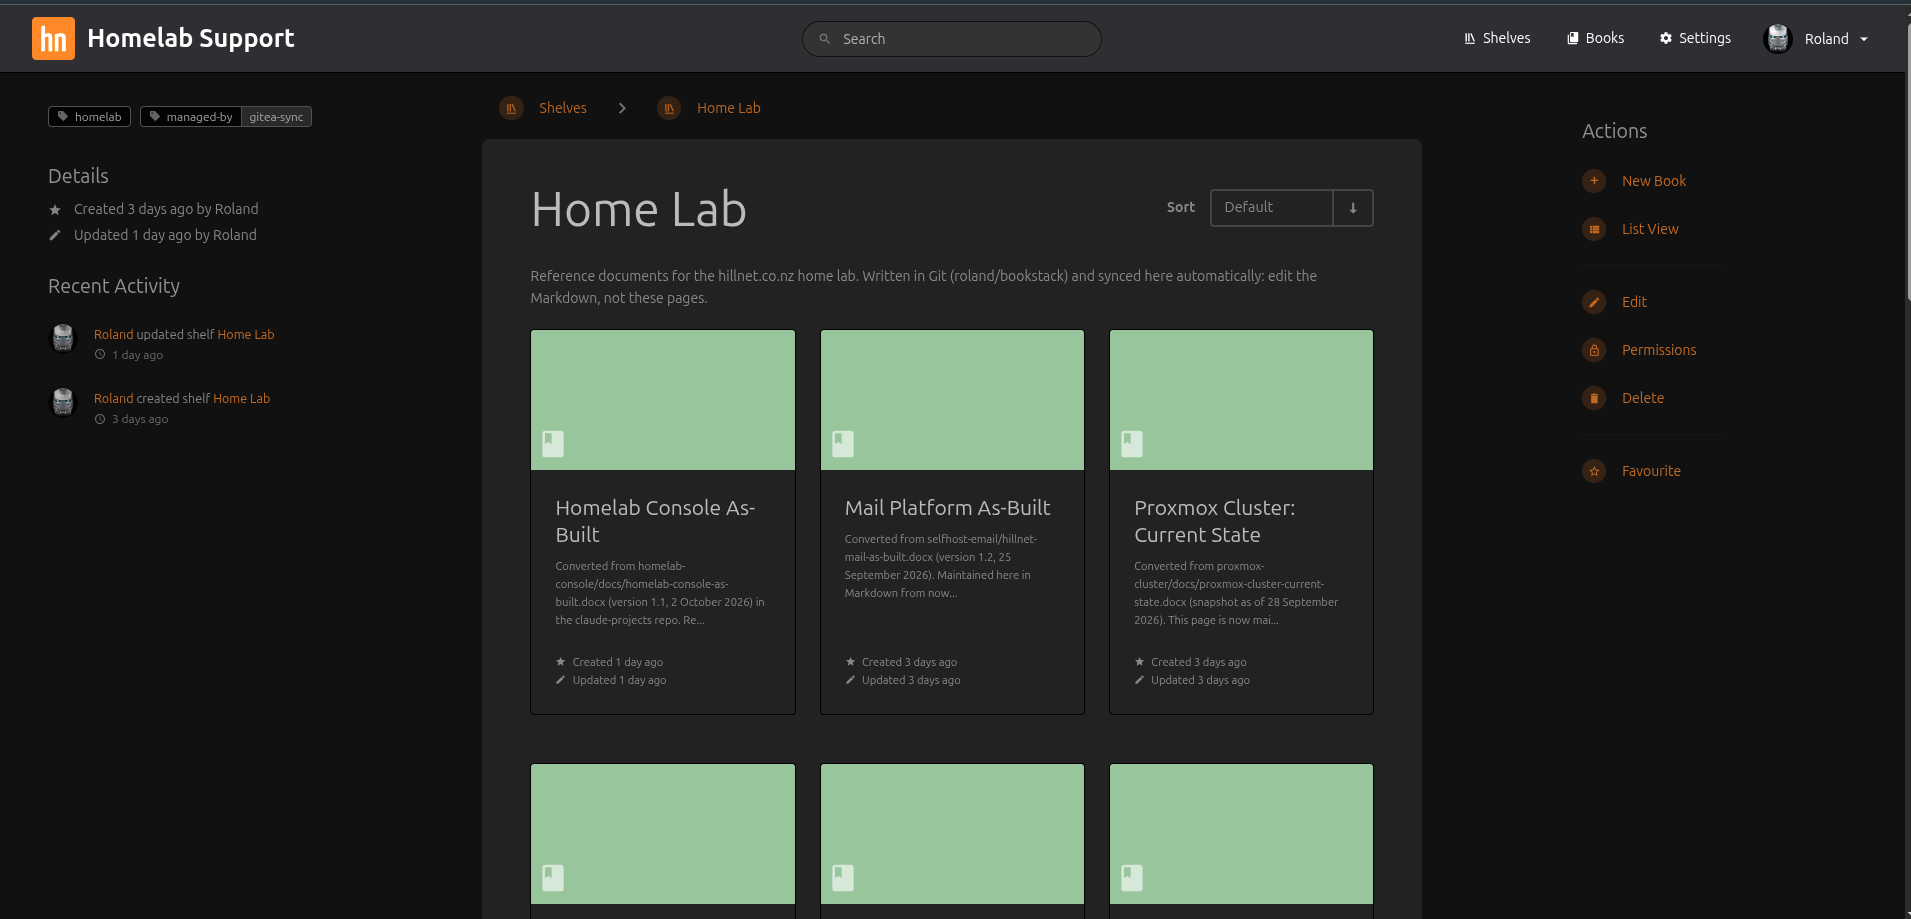
The BookStack Home Lab shelf showing several synced reference books

A Git-Backed Home Lab Knowledge Base with BookStack

How I built an internal BookStack knowledge base where Markdown in a private Git repo is the source of truth, synced automatically by Gitea Actions, with public posts derived only by a manual, reviewed step.

October 1, 2026 · Updated October 14, 2026 · 7 min · Roland Hill
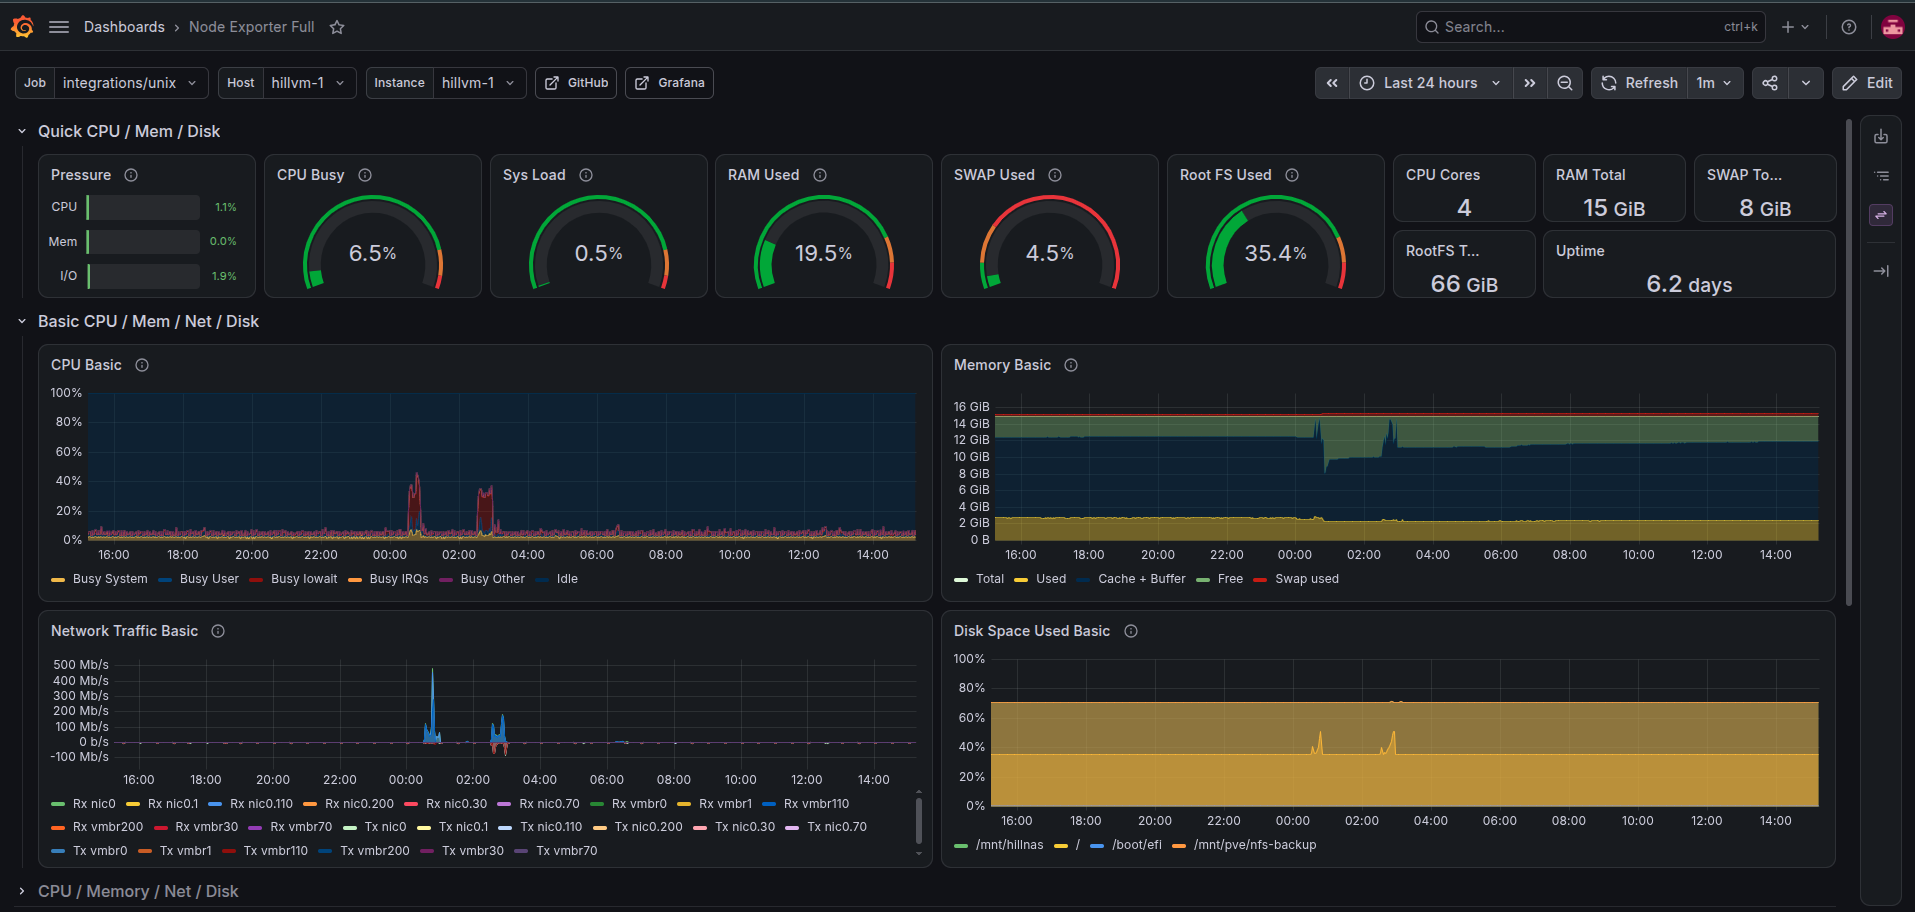
A Grafana Node Exporter Full dashboard showing CPU, memory, network and disk usage

Homelab Monitoring with Grafana, Loki, Prometheus and Alloy

How I centralised logs and metrics for my homelab with Grafana, Loki, Prometheus and Grafana Alloy, and what I learned about push-based collection, alerting and code-generated dashboards.

October 1, 2026 · Updated October 14, 2026 · 9 min · Roland Hill